Research & Teaching Portfolio
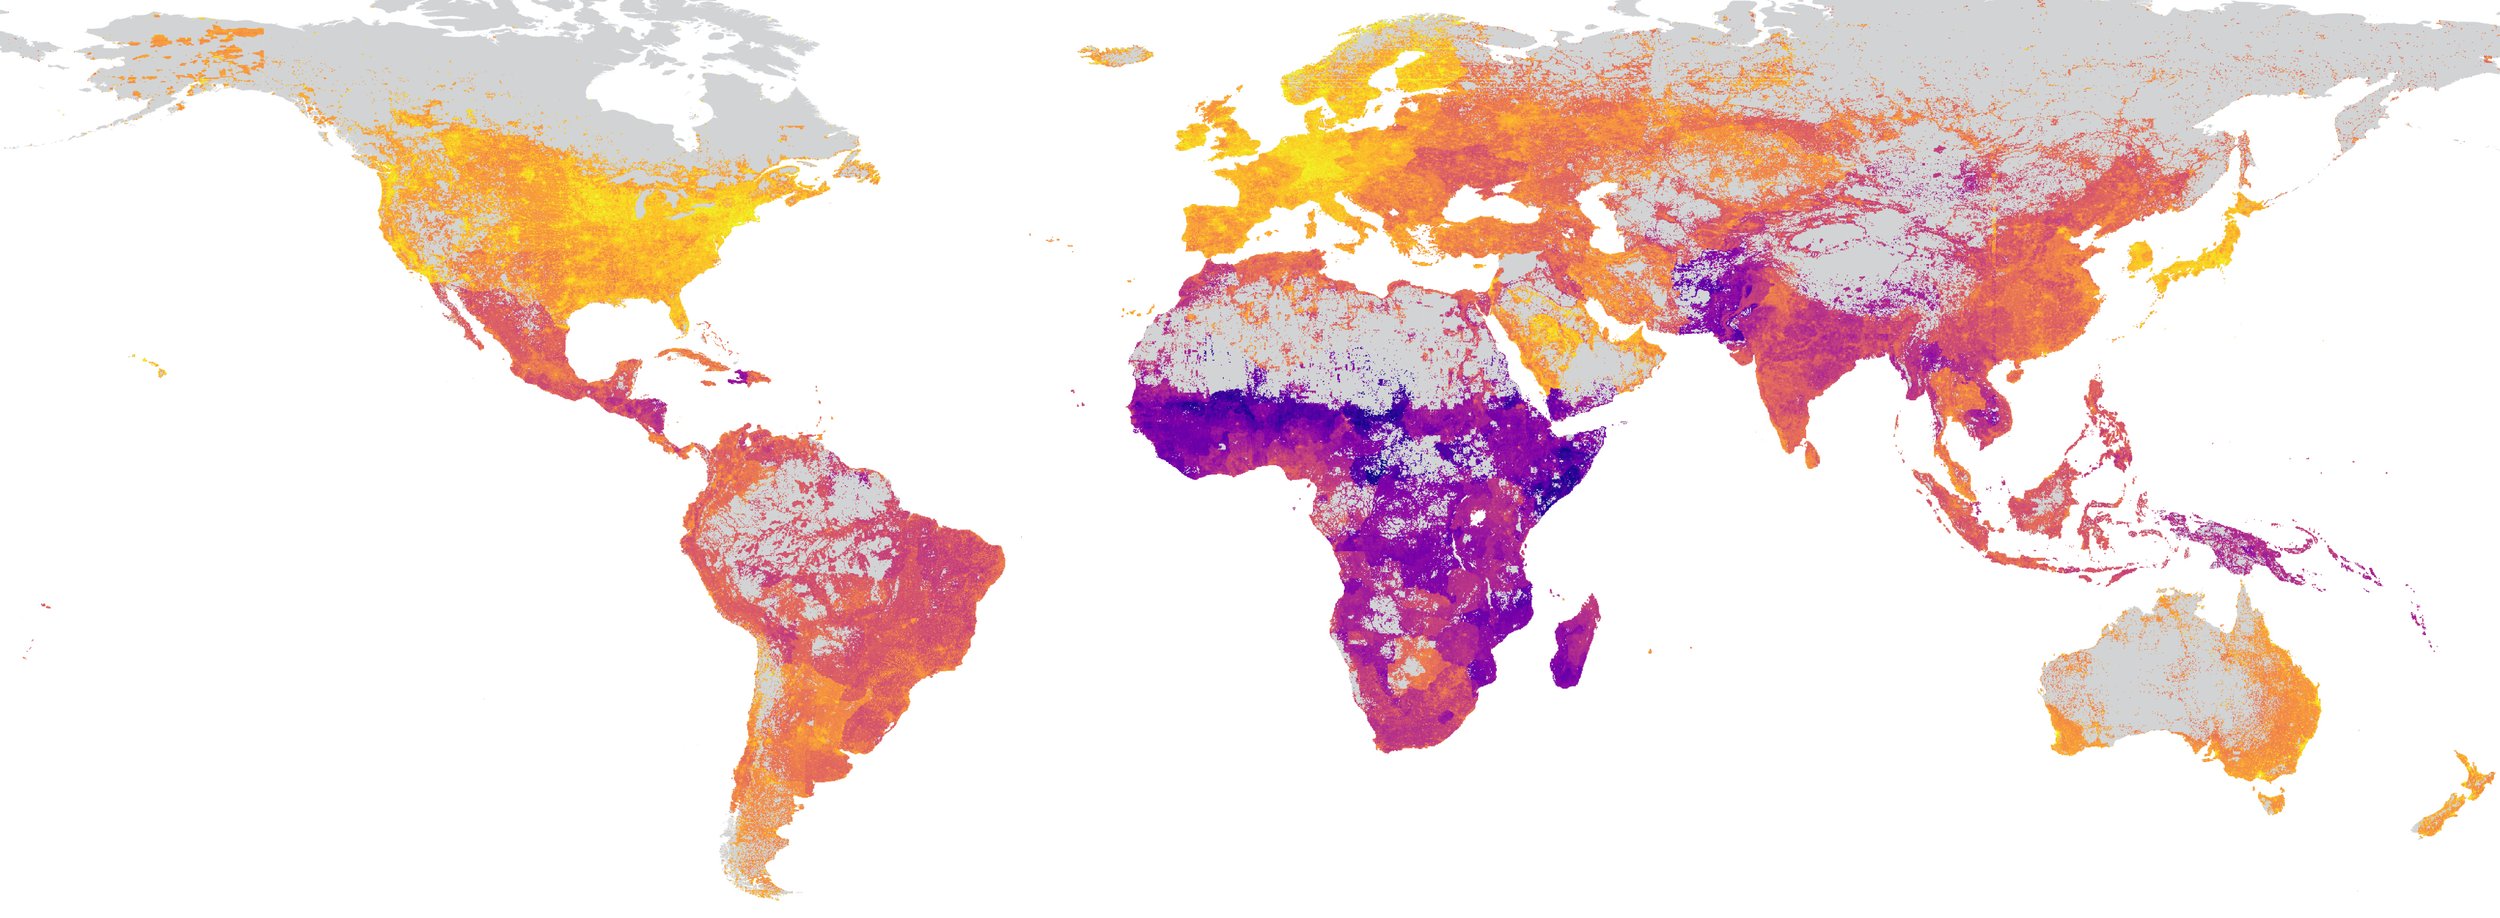
Wealth Mapping with AlphaEarth Embeddings
October 2025
This notebook explores the use of AlphaEarth embeddings for large-scale wealth and poverty mapping. We pull pretrained AlphaEarth representations via Google Earth Engine, visualize high-dimensional embeddings over urban areas, and then spatially and temporally match these features to survey clusters from the SustainBench dataset. The notebook trains regression models to predict wealth outcomes and maps prediction errors across countries, emphasizing how foundation model embeddings can be operationalized for socioeconomic inference and diagnostic spatial analysis.
Predicting Wealth & Poverty with SatCLIP
April 2025
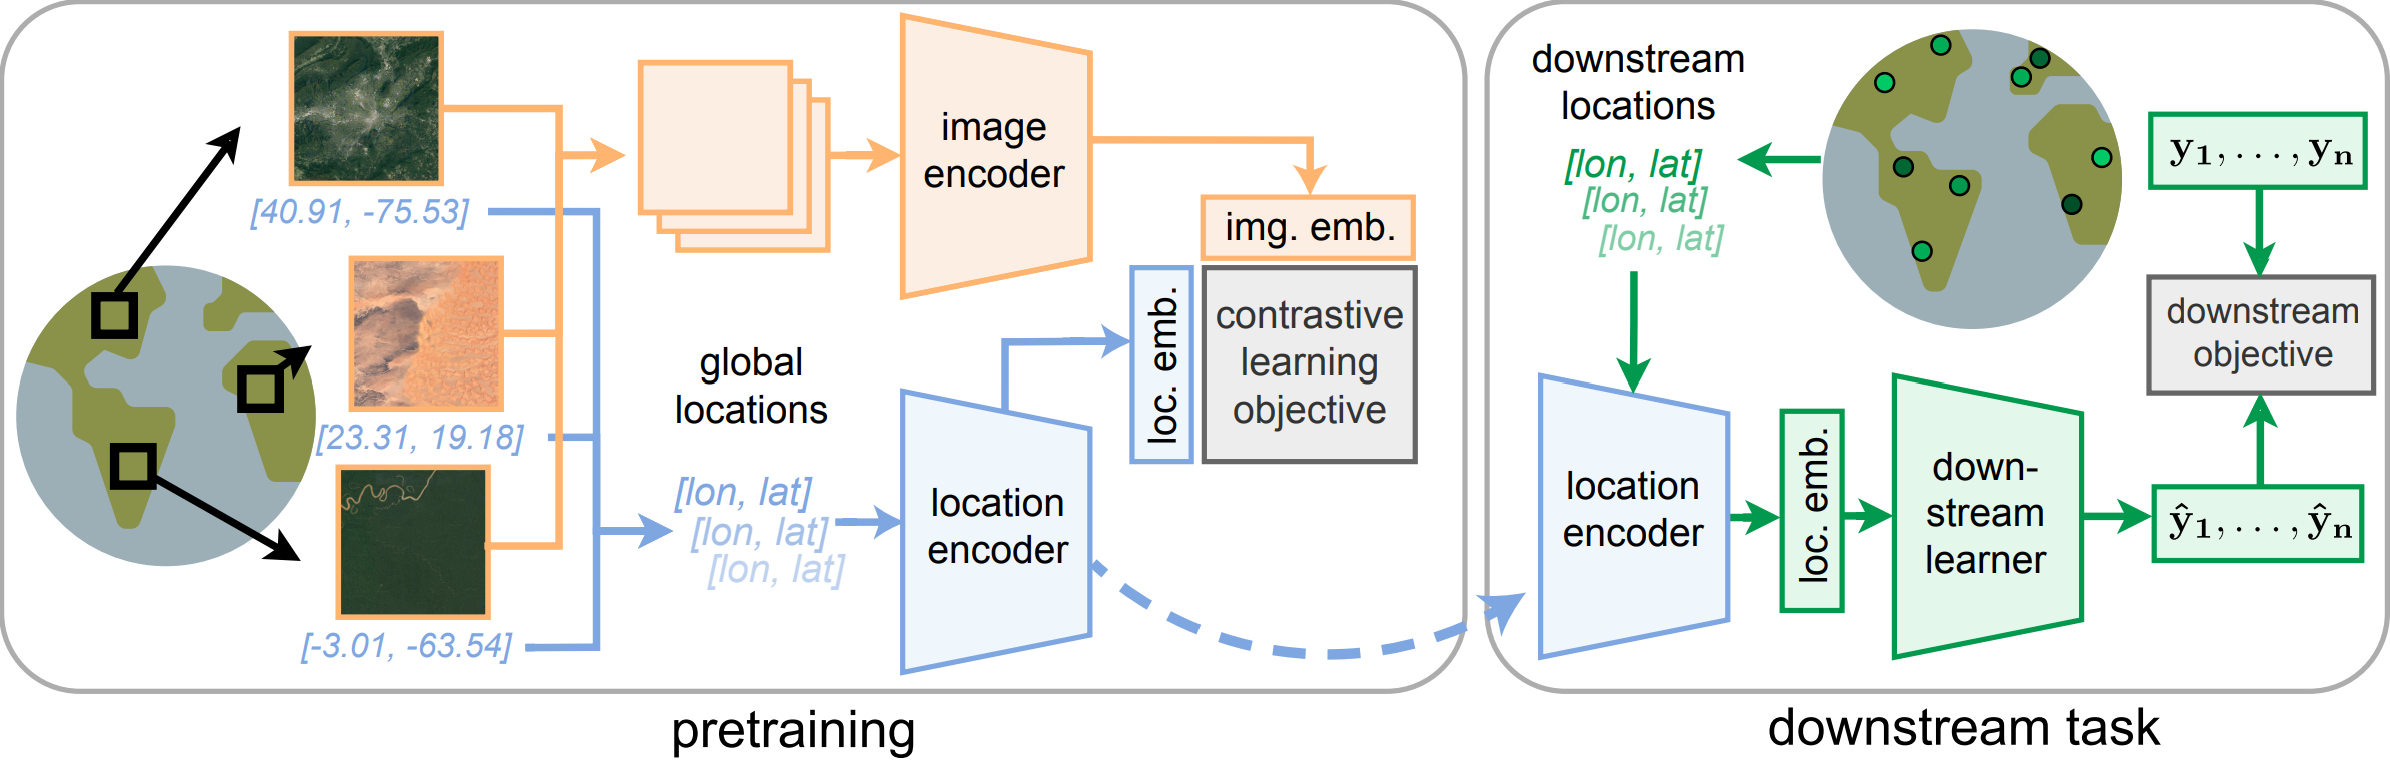
This notebook extends the wealth and poverty prediction pipeline by applying SatCLIP, a large-scale geospatial foundation model trained on 1.5 billion geotagged image–text pairs using contrastive learning. Building on the SustainBench Task 1A dataset, the notebook uses SatCLIP to extract location-aware embeddings from satellite imagery and geographic coordinates, and fits supervised models to predict the wealth_index for surveyed and unsurveyed locations. The exercise contrasts SatCLIP’s pretrained, semantically rich representations with simpler feature extractors, highlighting how internet-scale pretraining and location encodings can improve socioeconomic prediction from remote sensing data.
Predicting Wealth & Poverty with MOSAIKS
April 2025
This notebook builds directly on the SustainBench poverty and wealth dataset introduced in the previous lesson by fitting geospatial image embeddings to predict the wealth_index for unsurveyed locations. Using MOSAIKS (Multi-Task Observation using Satellite Imagery & Kitchen Sinks), a lightweight geospatial foundation model based on random convolutional features, the notebook demonstrates how high-dimensional satellite image embeddings can be paired with survey-derived labels to estimate relative economic well-being. We extract MOSAIKS features from satellite imagery, train a linear regression model to predict wealth outcomes, and evaluate model performance, illustrating how simple, scalable representations can support spatial economic inference in data-scarce regions.
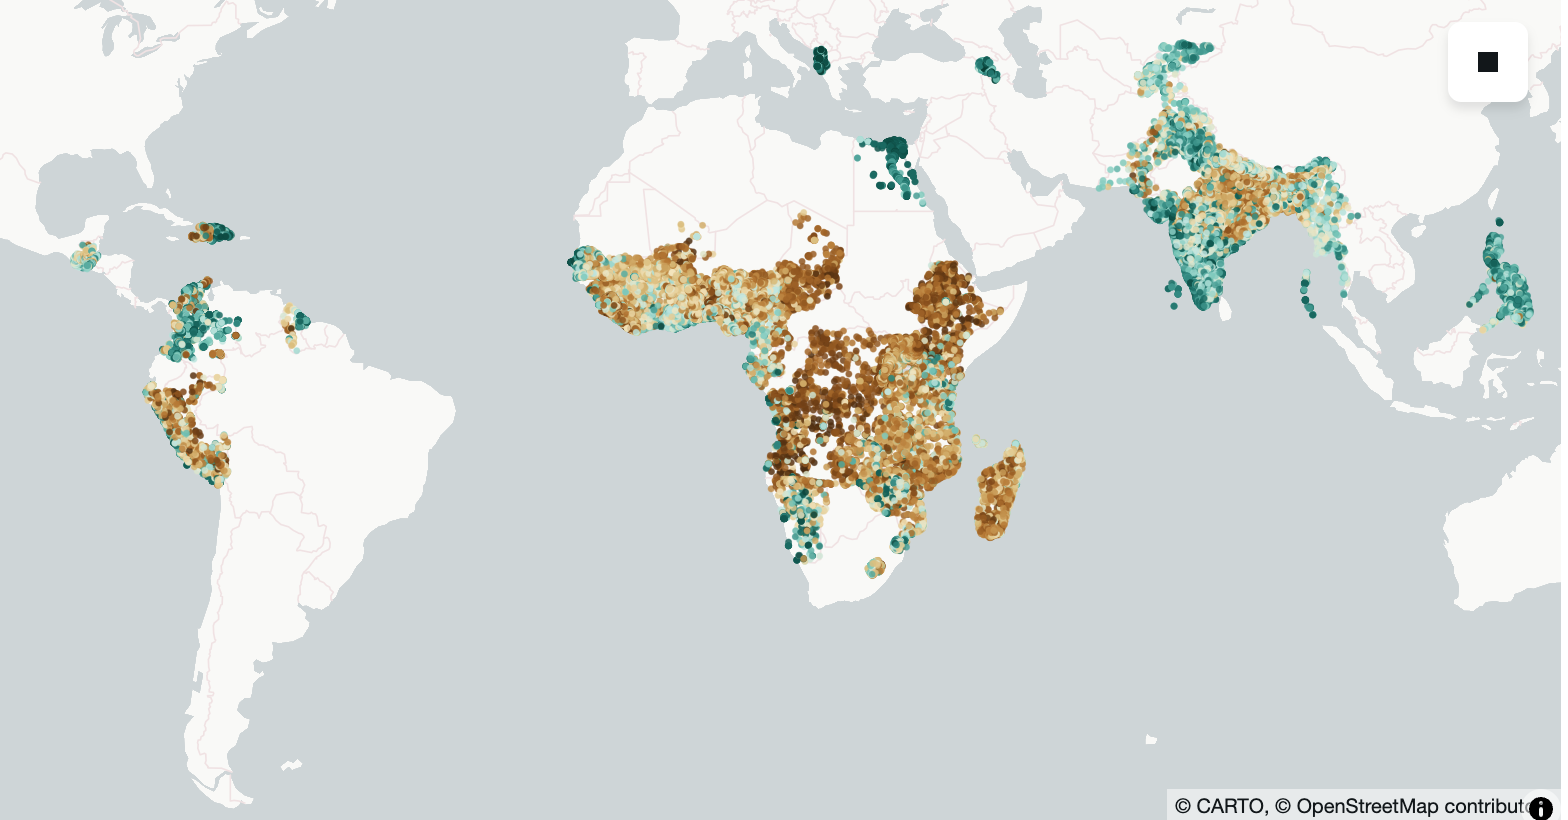
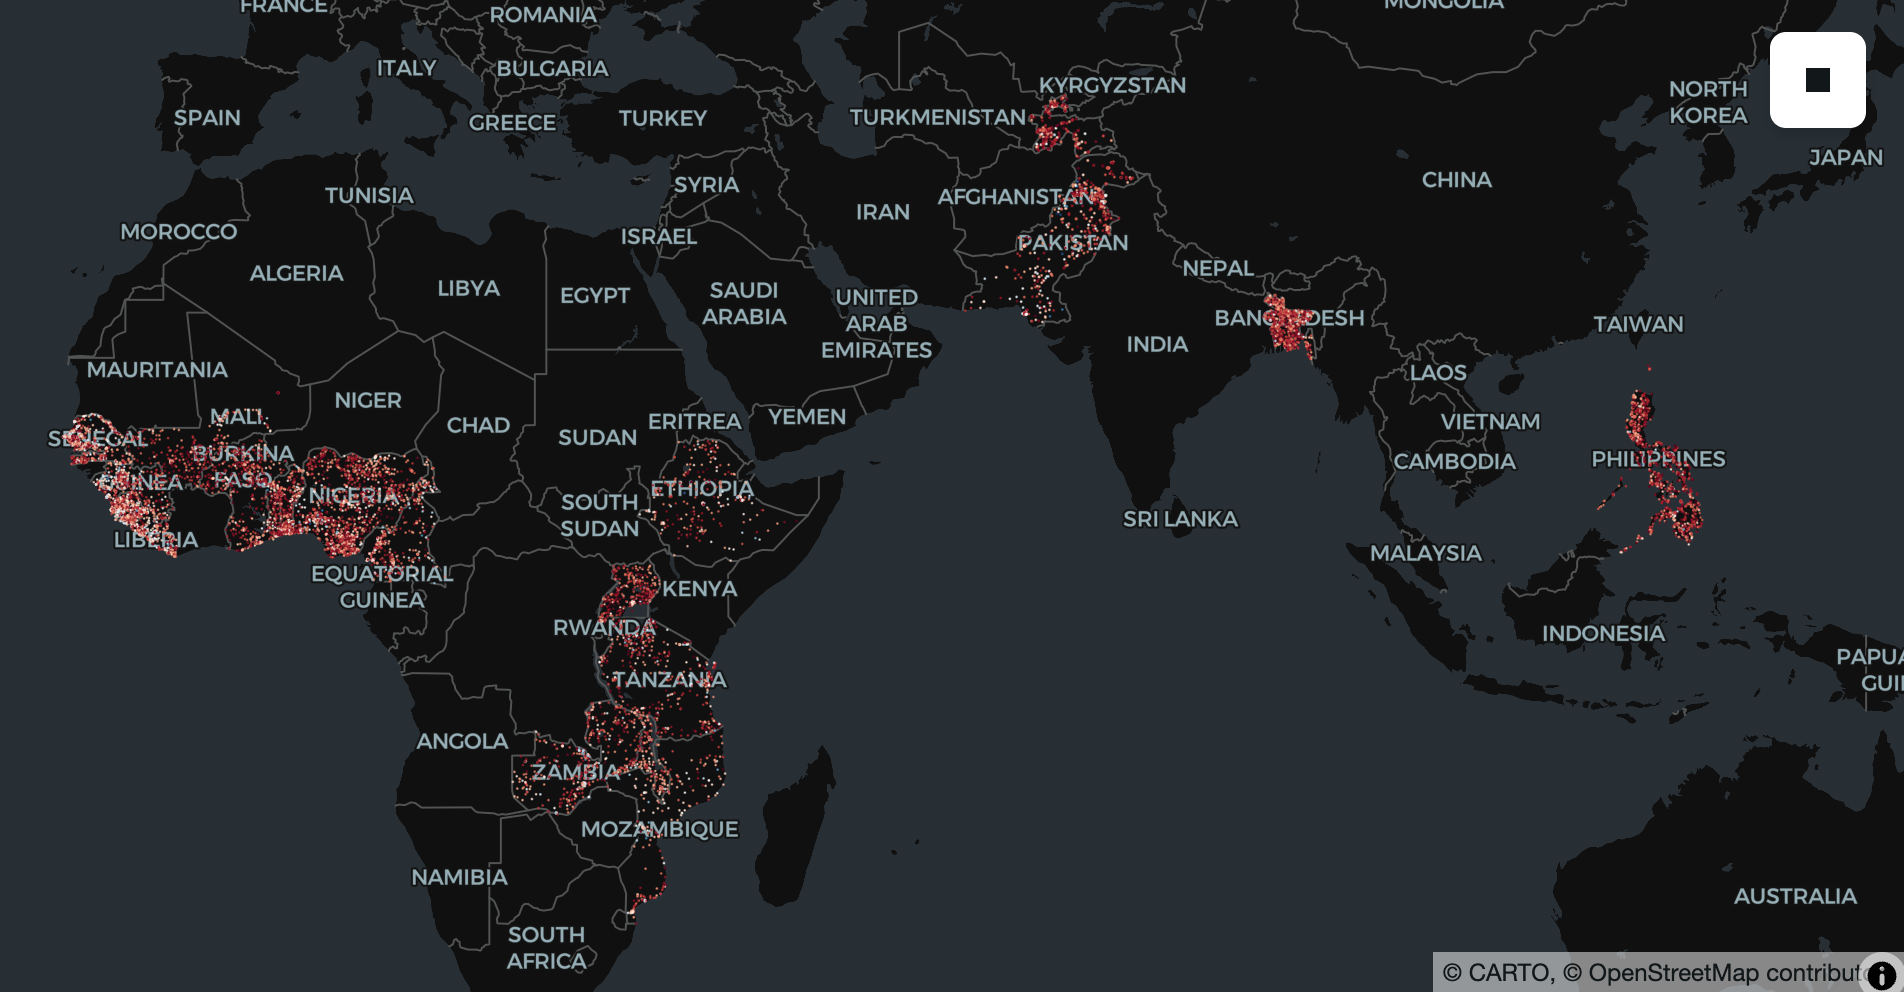
Pulling and Visualizing Wealth & Poverty Data with SustainBench
March 2025
This notebook introduces students to benchmark datasets for spatial poverty and wealth mapping using SustainBench, a 2021 dataset released by the Stanford Sustainability and AI Lab. Focusing on Task 1A, the notebook pulls geotagged cluster-level data derived from Demographic and Health Surveys (DHS) conducted across dozens of low- and middle-income countries. Students explore how anonymized survey data—jittered to protect household privacy—can be used to study spatial patterns of wealth and poverty, and visualize these patterns at scale. The notebook situates this dataset within the broader literature on predicting economic well-being from satellite and street-level imagery, and sets the foundation for subsequent notebooks that apply geospatial foundation models such as SatCLIP and MOSAIKS for feature extraction and poverty prediction.
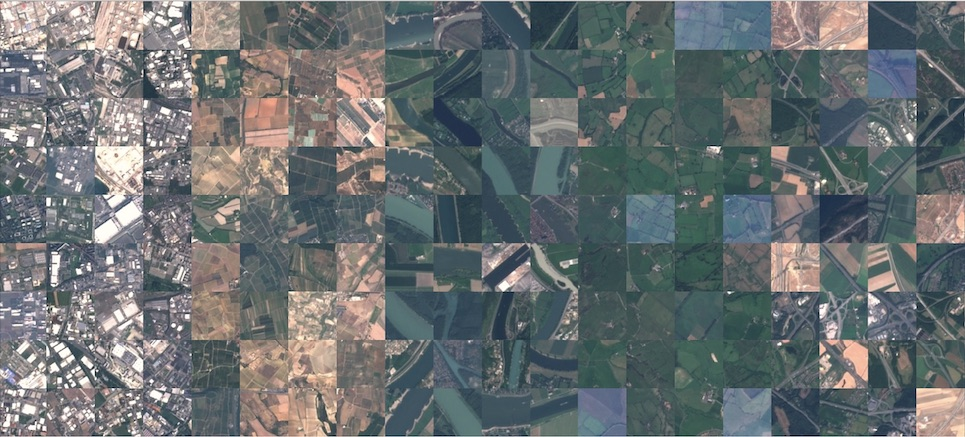
GeoML with EuroSAT and TorchGeo: Image Classification with Sentinel-2
February 2025
This notebook was developed for Week 4 of AI for Good, a course I co-teach with Professor Zia Mehrabi. Building on a prior introduction to PyTorch with a simple MLP, this lesson introduces TorchGeo, a geospatial deep learning library designed to work seamlessly with PyTorch and remote sensing data. Using the EuroSAT benchmark dataset—27,000 labeled Sentinel-2 image patches over Europe—the notebook walks through training a convolutional neural network (ResNet) for land-use and land-cover classification, and systematically compares randomly initialized weights with pretrained weights. The exercise emphasizes practical geospatial ML workflows, including dataset handling, model initialization, and performance evaluation using satellite imagery.
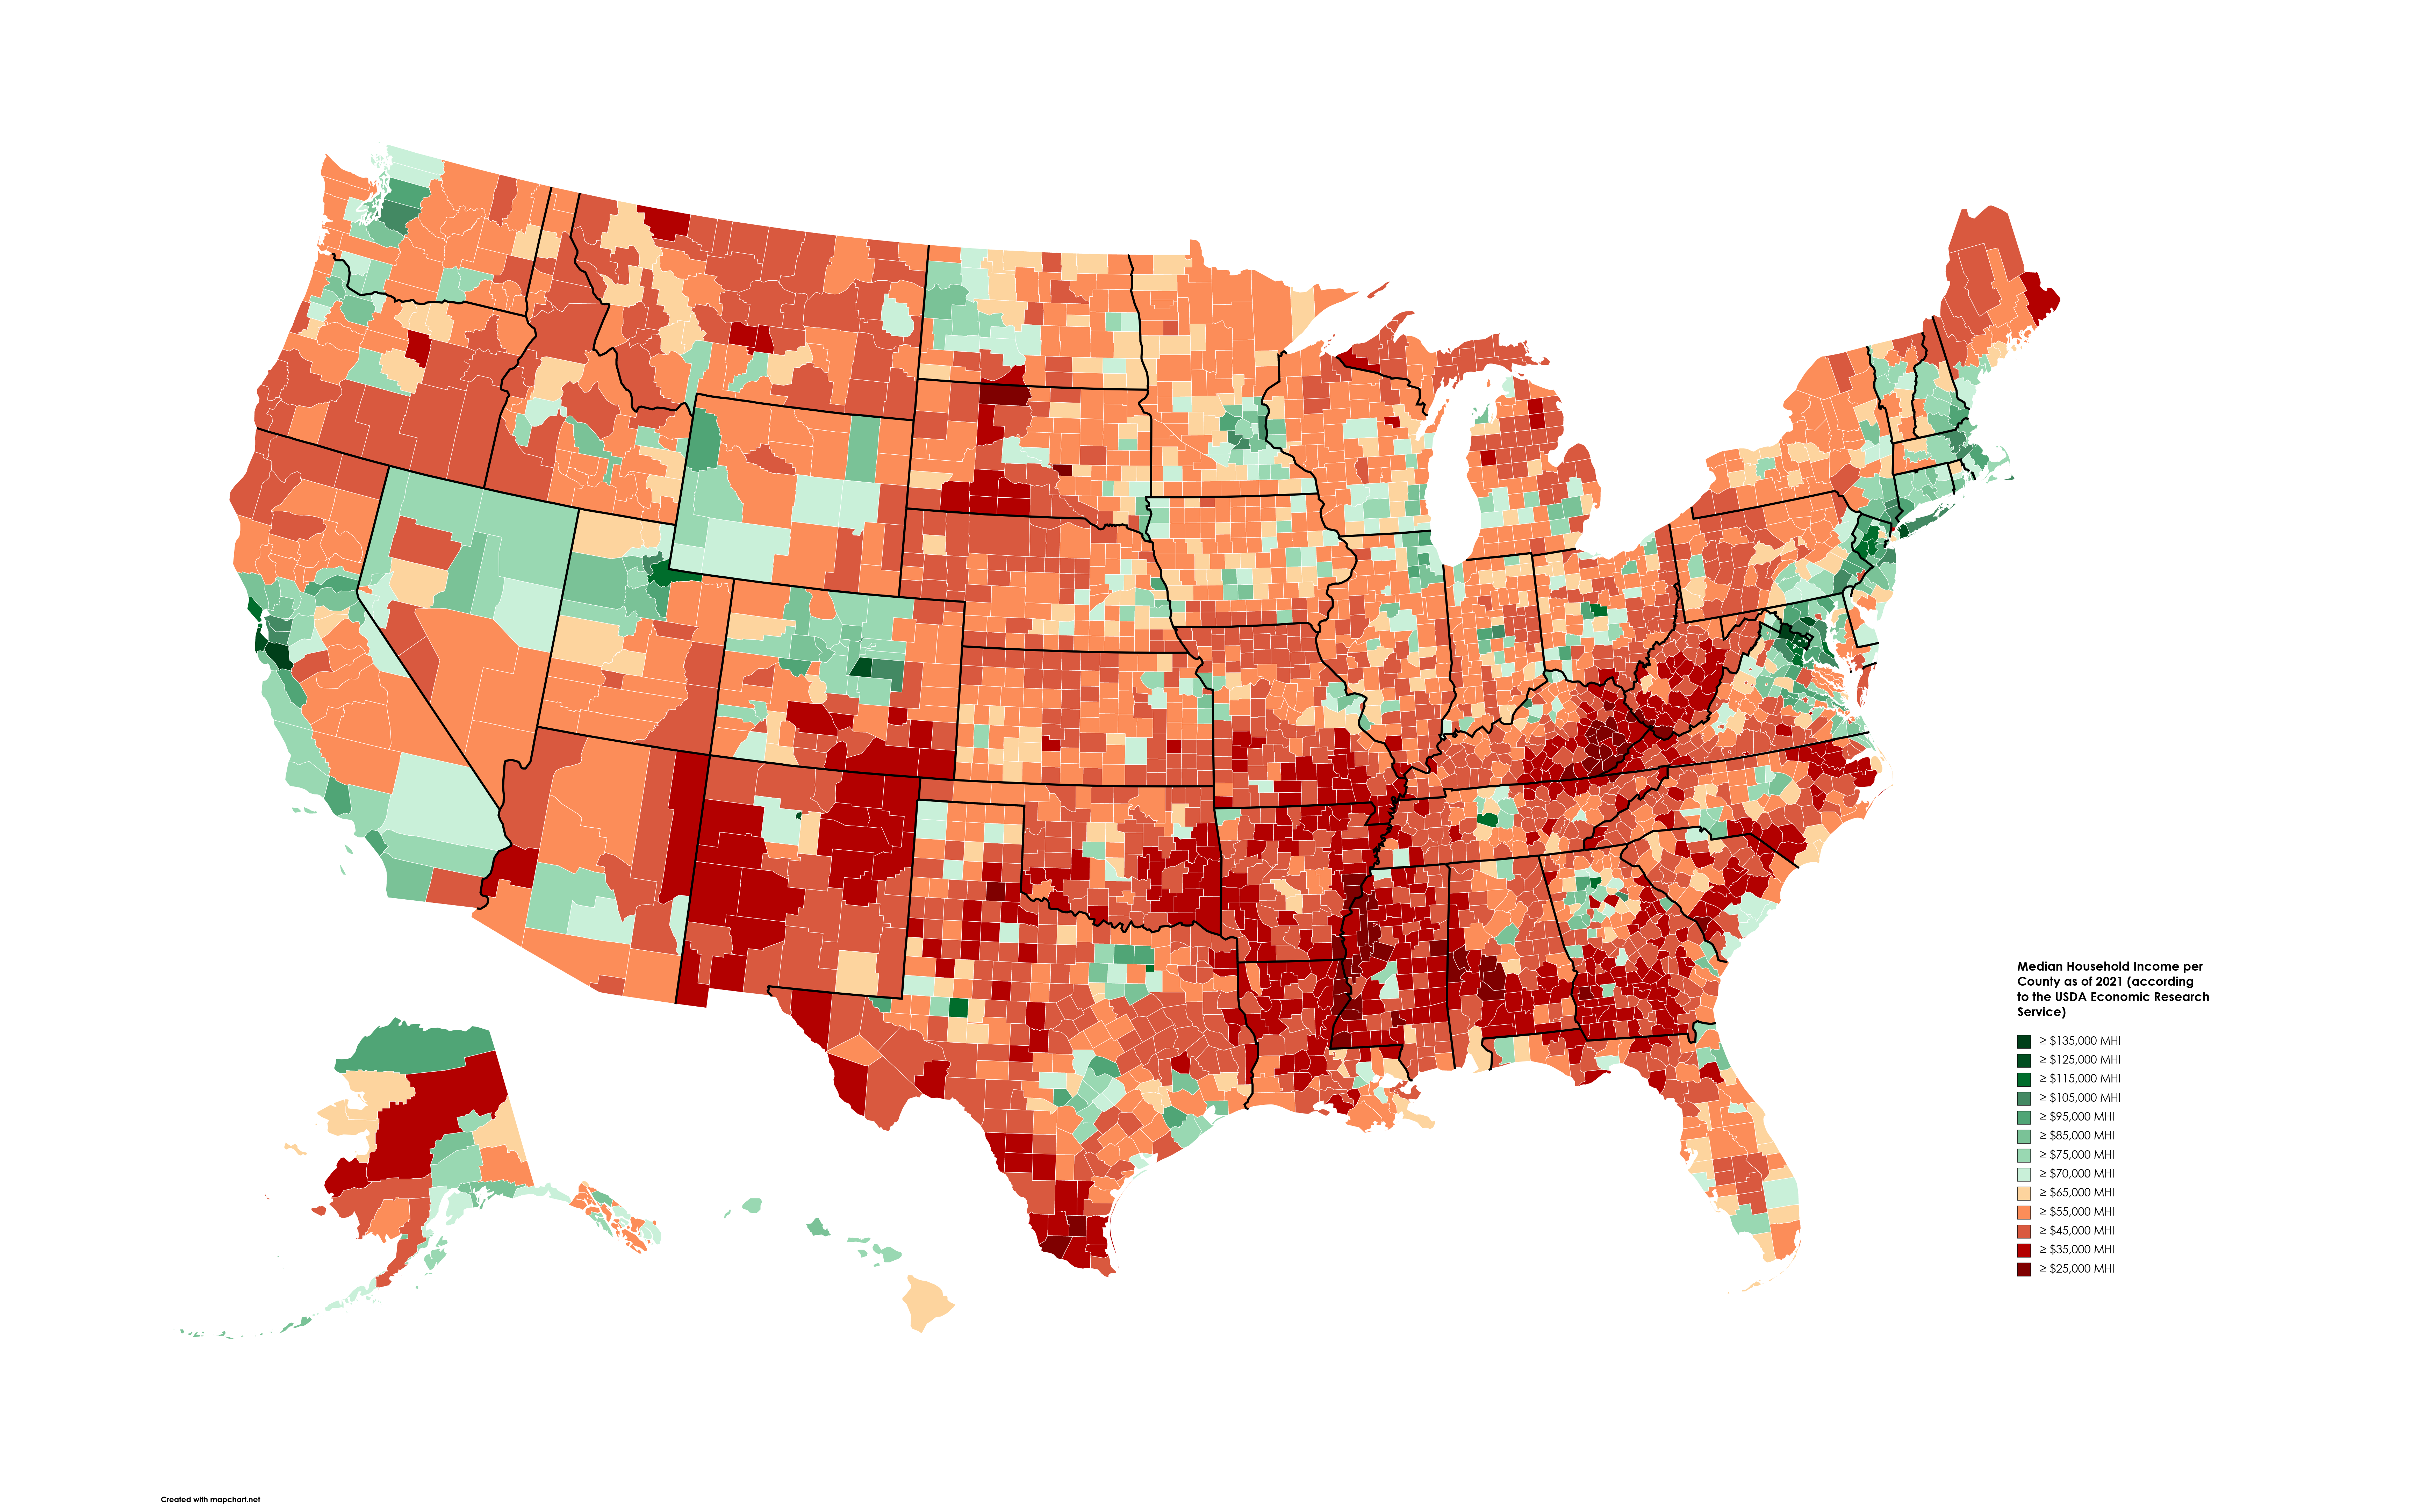
Introduction to MLPs with US Census Income Data
January 2025
This notebook was developed for Week 3 of AI for Good, a course I co-teach with Professor Zia Mehrabi. It introduces multi-layer perceptrons (MLPs) through a supervised classification task using the U.S. Adult Census Income dataset. Students explore demographic and socioeconomic features from the 1994 U.S. Census and train models to predict whether an individual earns above or below $50,000 per year. The notebook walks through data ingestion from Kaggle, exploratory data analysis, train–test splitting, and benchmarking classical machine learning models before implementing and training a simple artificial neural network in PyTorch. The goal is to build intuition for neural network architectures while highlighting common preprocessing and evaluation considerations in applied social data.
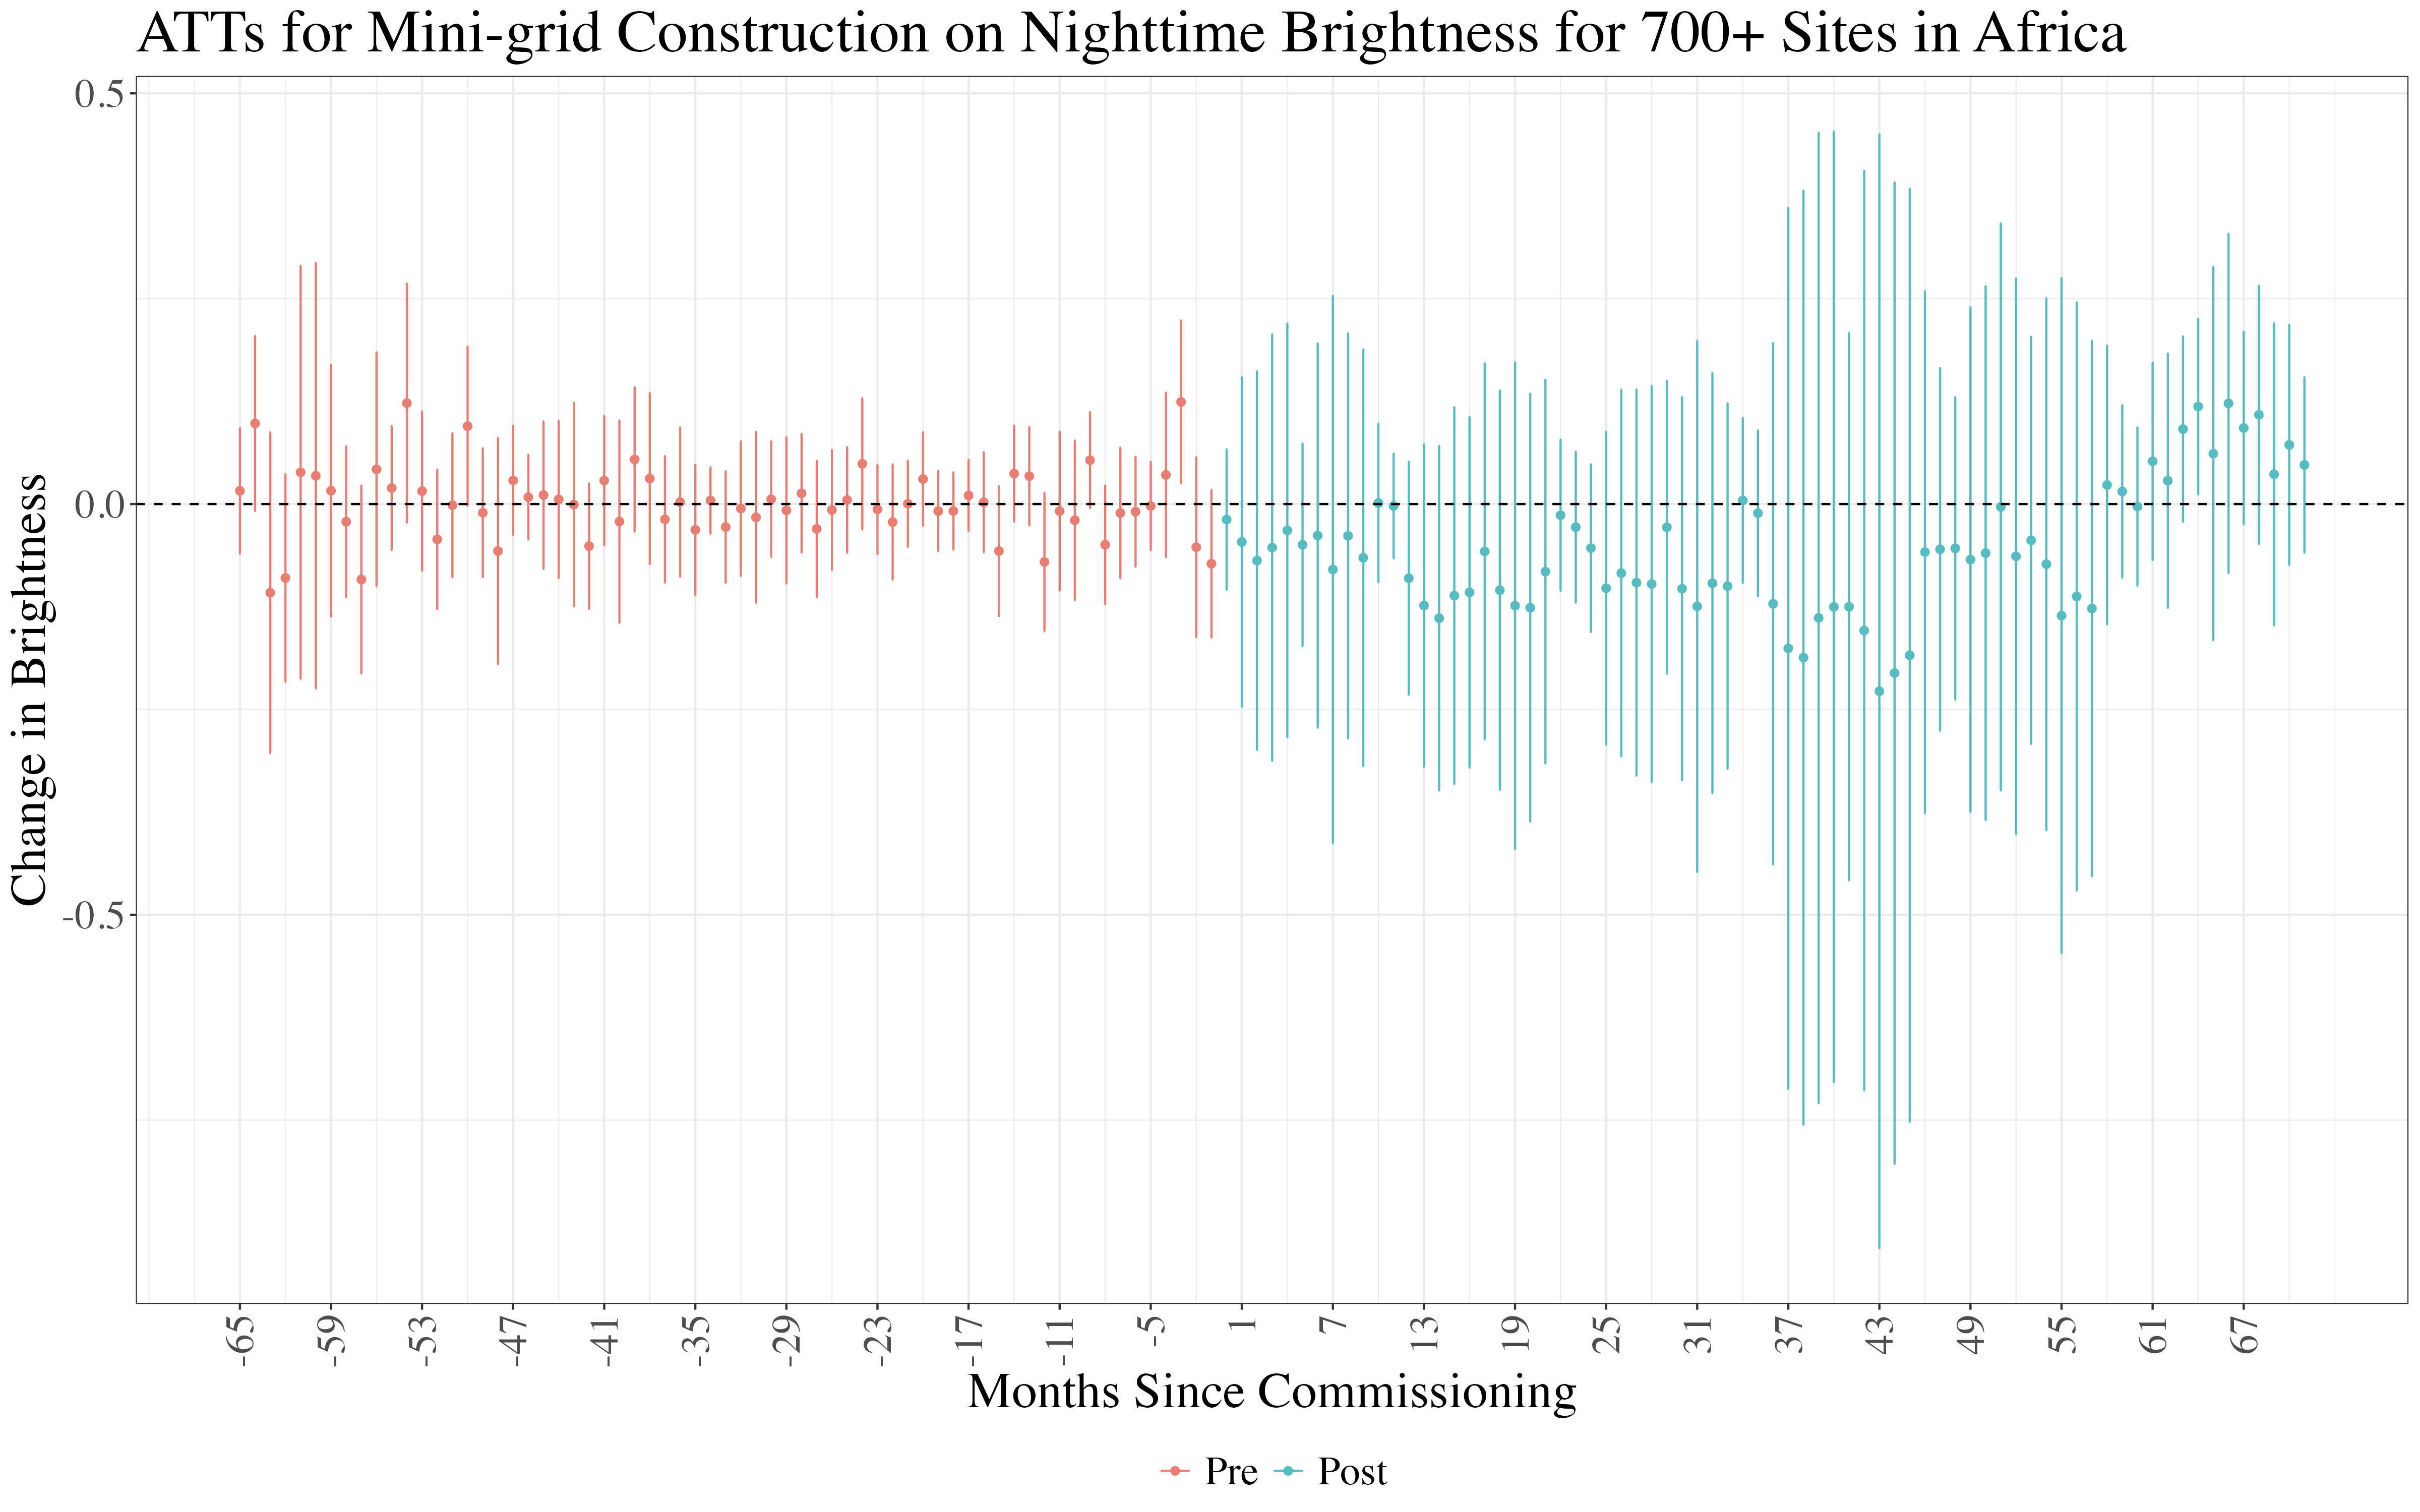
Causal Inference Analysis for Nighttime Brightness of Mini-Grids in Africa
May 2024
This notebook looks at nighttime brightness values for 700+ mini-grid locations across 20 countries in Africa and compares them with control locations using a modern Difference-in-Differences (DinD) method from Callaway & Sant'Anna (2021). The analysis finds that mini-grids do not have a statistically significant increase in nighttime brightness after their installation, indicating that they may not be detectable from space.
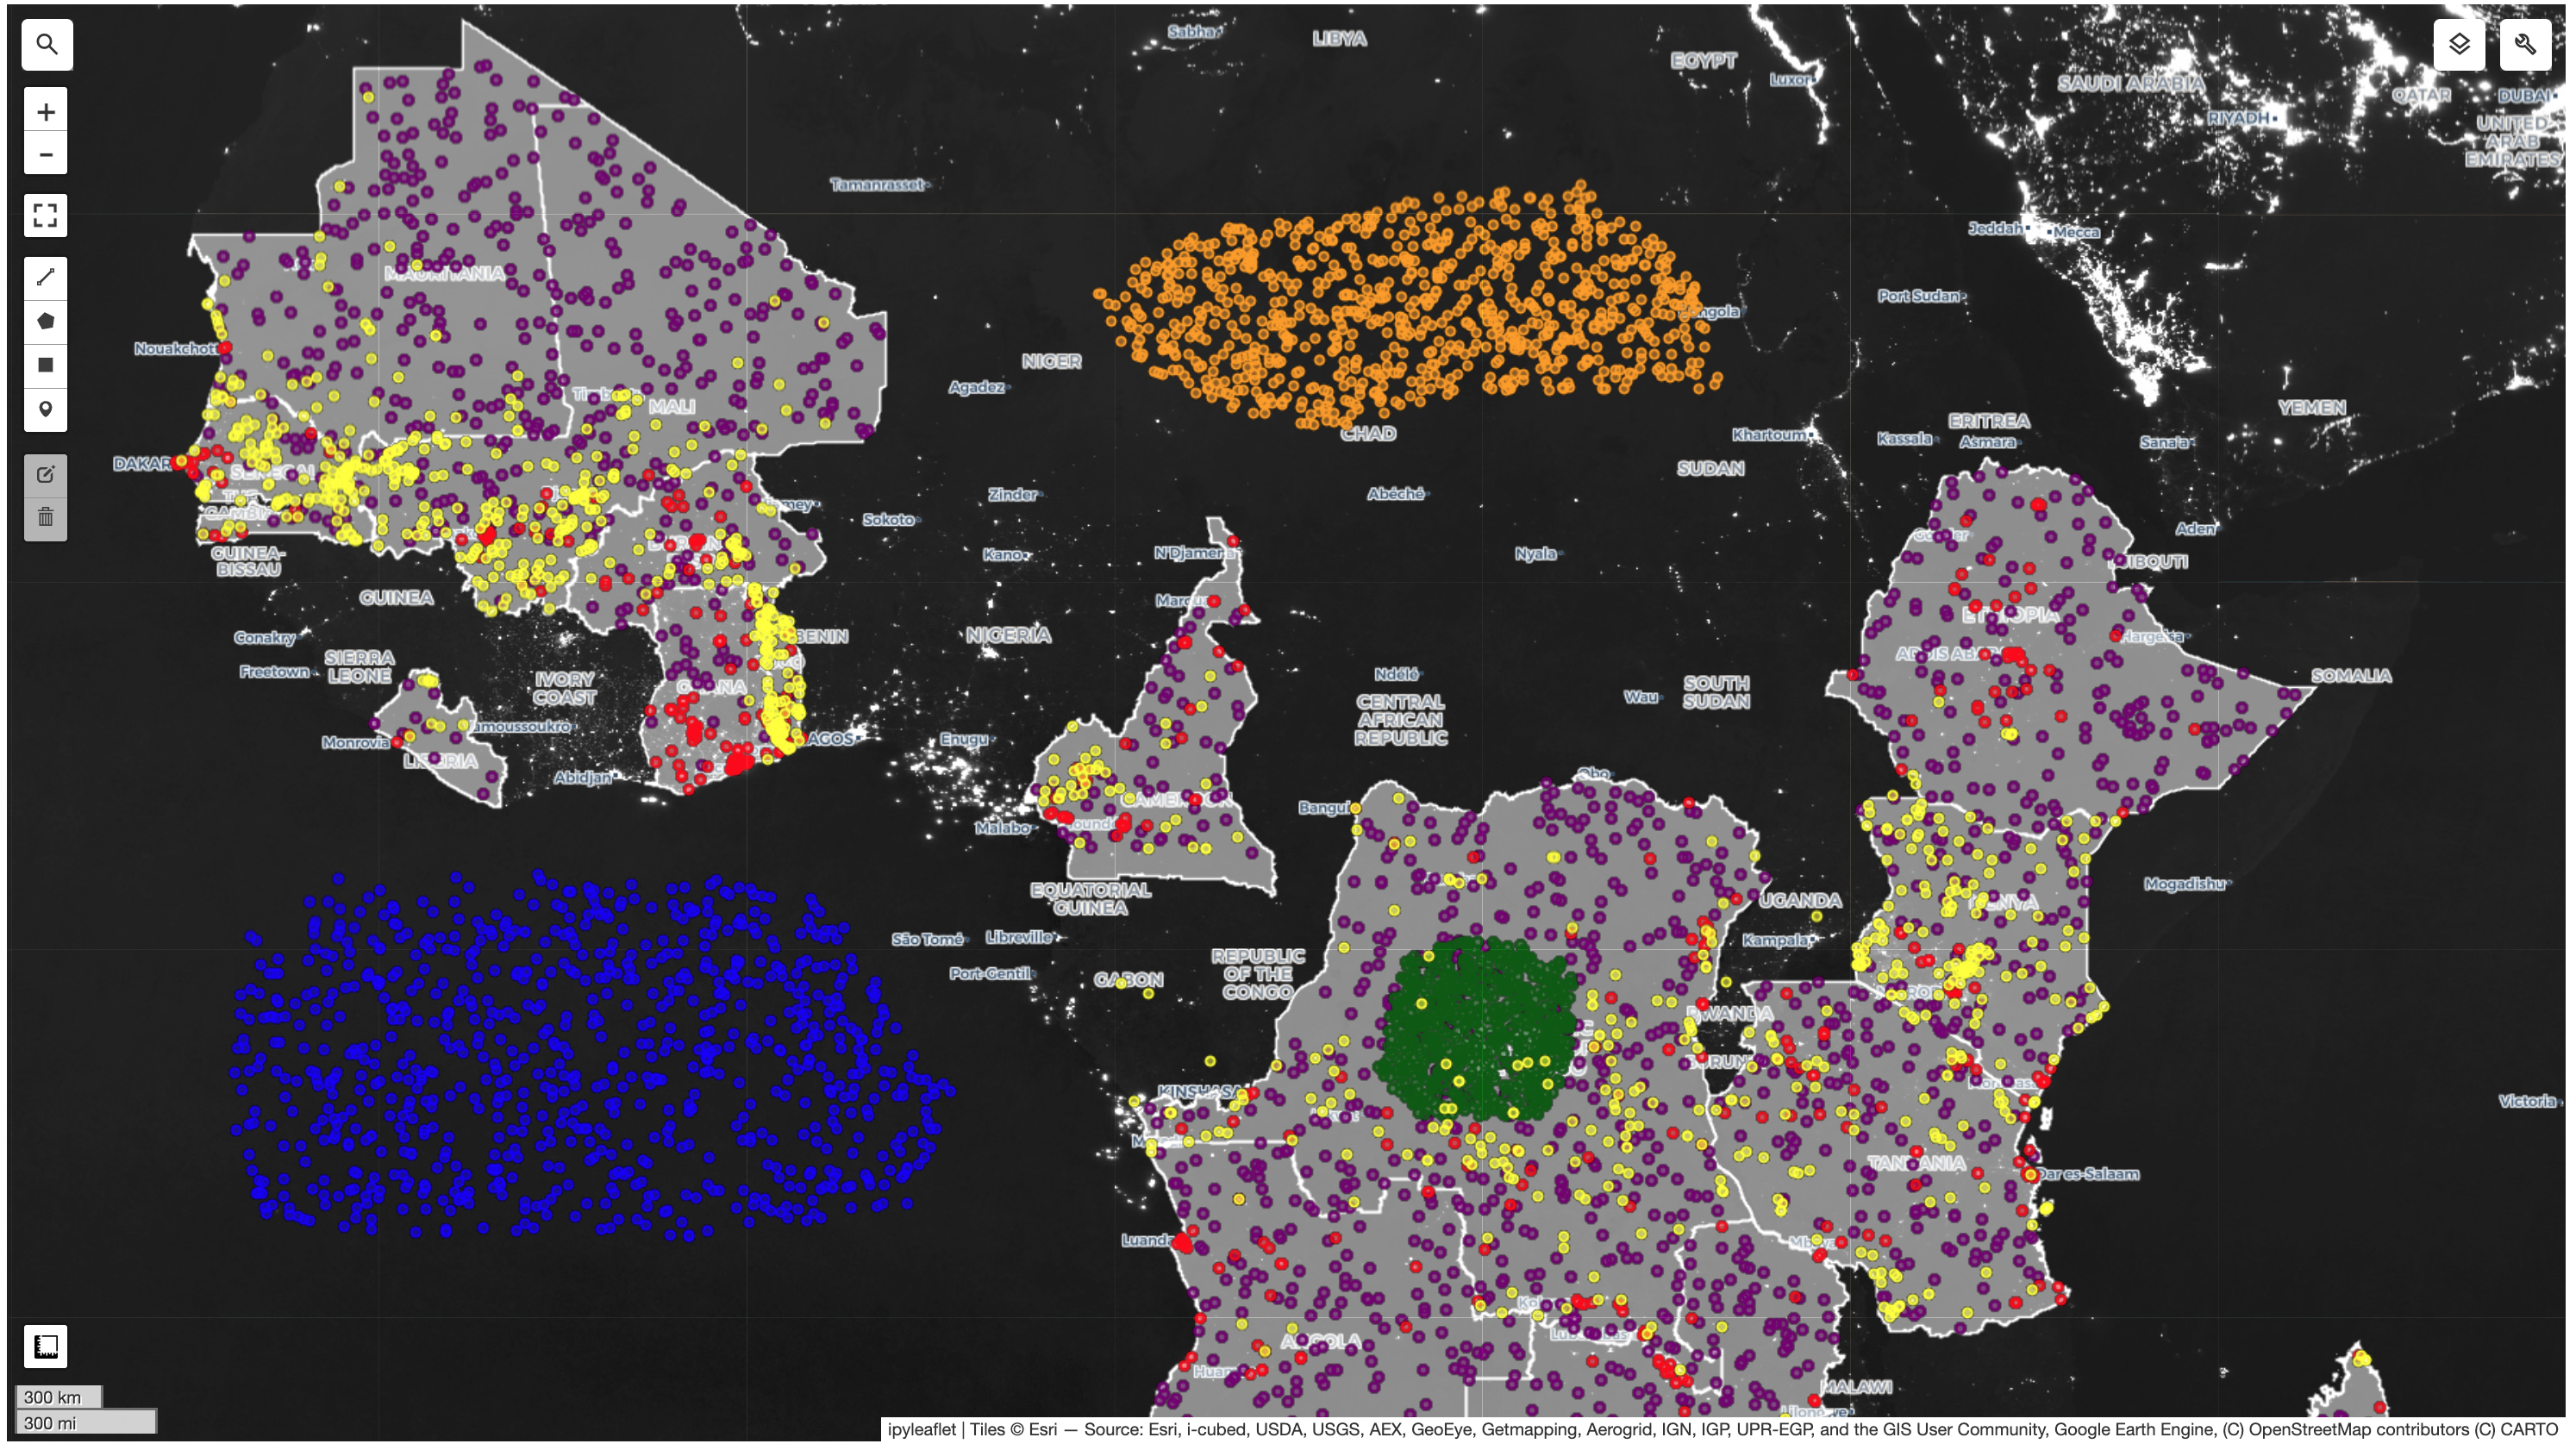
Sampling Google Earth Engine for VIIRS Nightime Lights Brightness at Mini-Grids and Dark Areas across Africa
April 2024
This notebook pulls in 700+ mini-grid locations across 20 countries in Africa, and finds thousands of other sample points to use as control areas. Nighttime brightness values are sampled for every month from 2014-2023, and then converted into a geodata frame for further analysis.
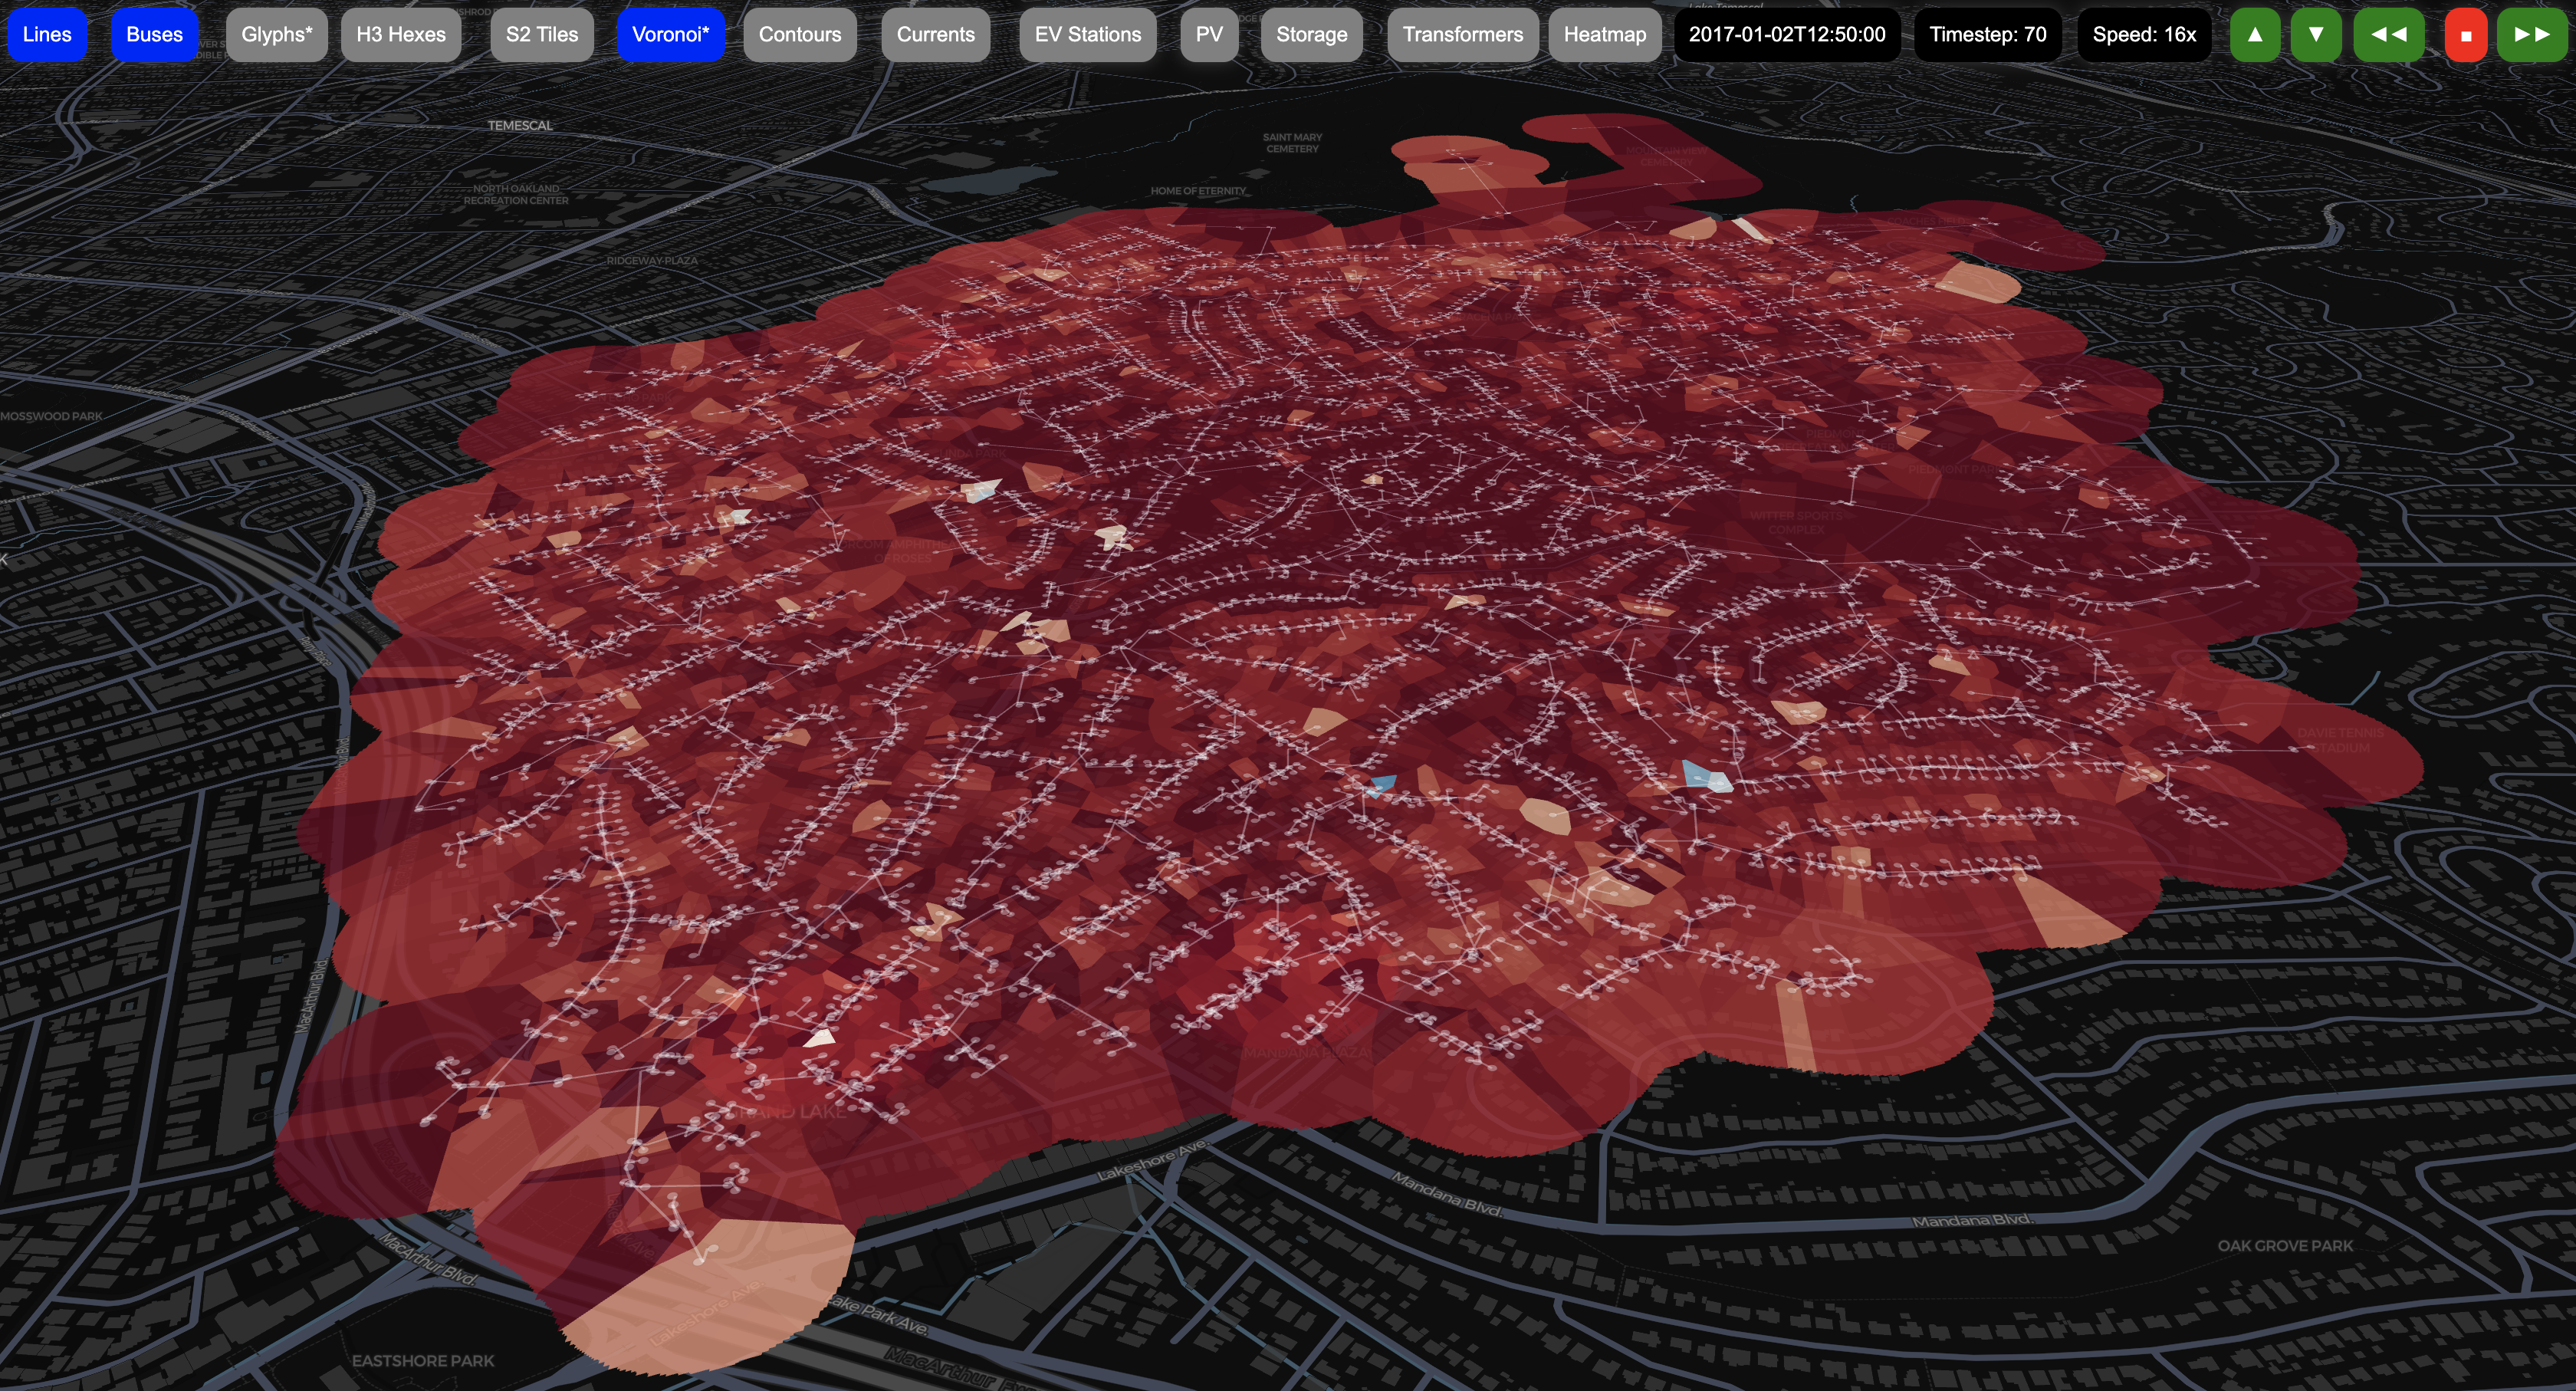
Electricity Distribution Grid Voltage Visualization App
Feburary 2024
This interactive, animated web-application visualizes the voltage of over 20,000 buses on a sythentic electricity distribution grid in Oakland, CA over a 24-hour period. I use 5 different visualization systems as well as 6 different grid components to compare their effectiveness in communicating the data. The app is built with Vite.js web framework along with Deck.gl geovis layers. This project was funded by the National Renewable Energy Lab and is published in https://www.computer.org/csdl/proceedings-article/energyvis/2023/302800a011/1SQrf45KR6o.
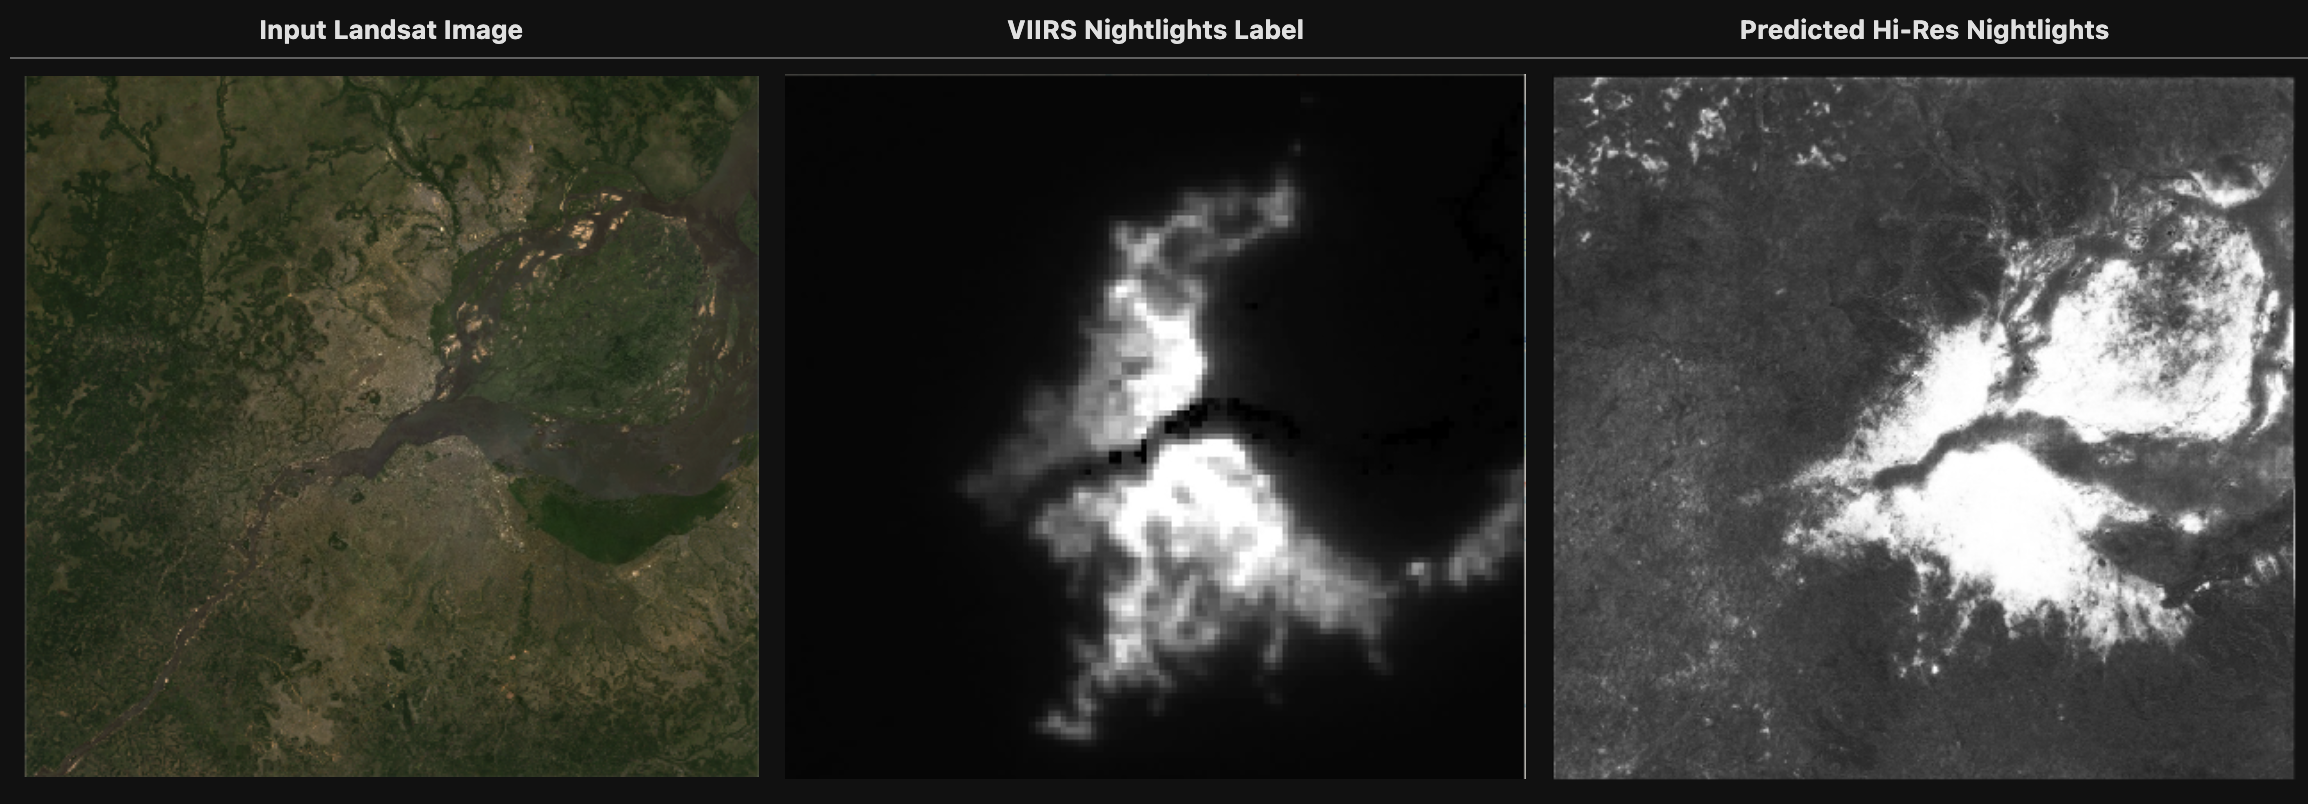
Super-Resolution of VIIRS with Landsat-8 and U-Net
January 2024
This notebook attempts to superresolve the VIIRS nightlights of Earth from 450 meters per pixel down to 30 meters per pixel by training a U-Net to infer nightlights based on 8 bands of Landsat-8.
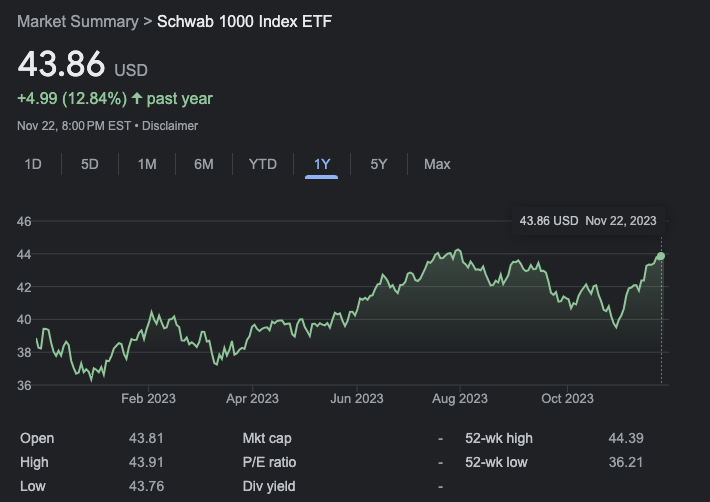
Stock Market ETF Prediction with an LSTM & an RNN
December 2023
This notebook attempts to predict the ETF Index SCHK using historical data from Yahoo finance. Both a Recurrent Neural Network (RNN) and a Long Short Term Memory (LSTM) model are used.
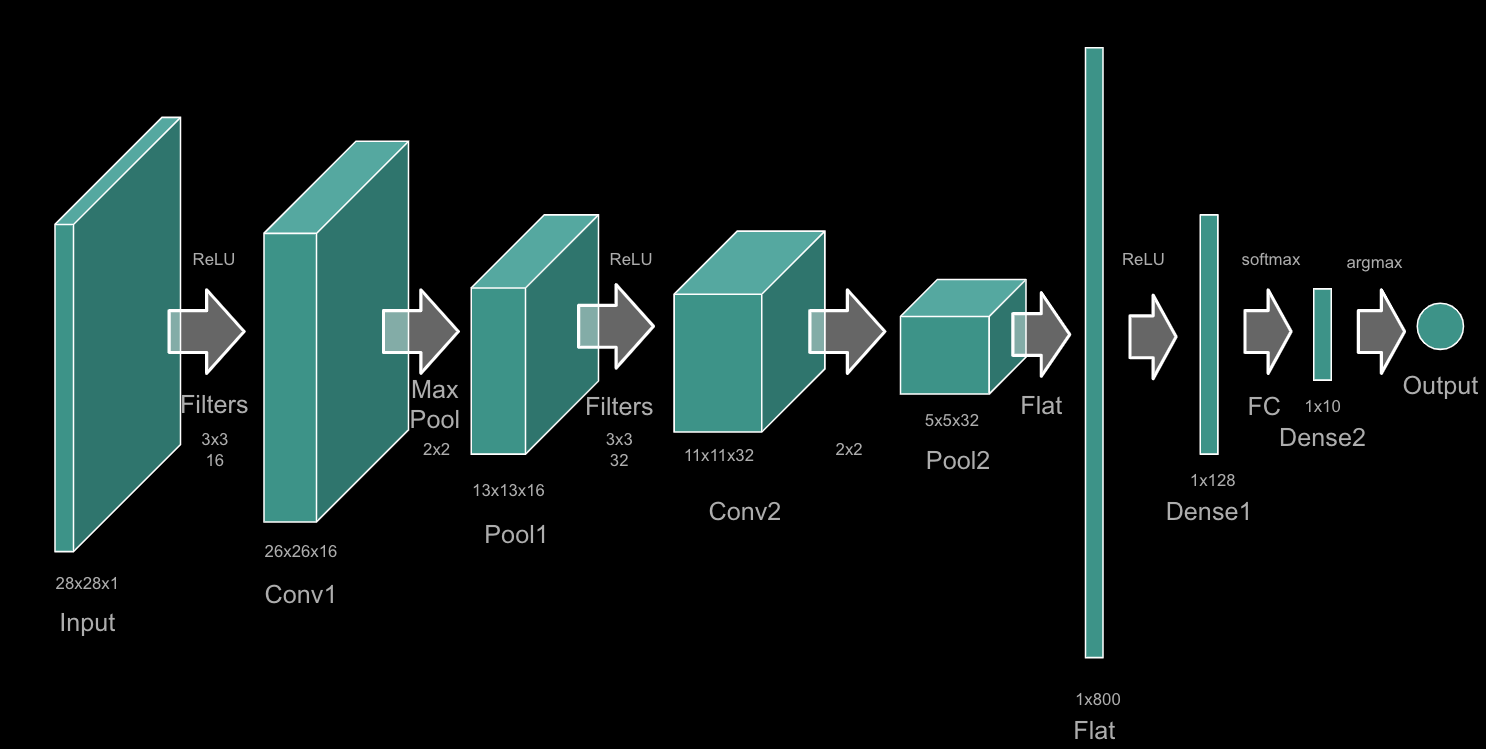
MNIST Classification with a CNN
November 2023
This notebook creates a simple Convolutional Neural Network with keras to classify handwritten digits from the iconic MNIST dataset.
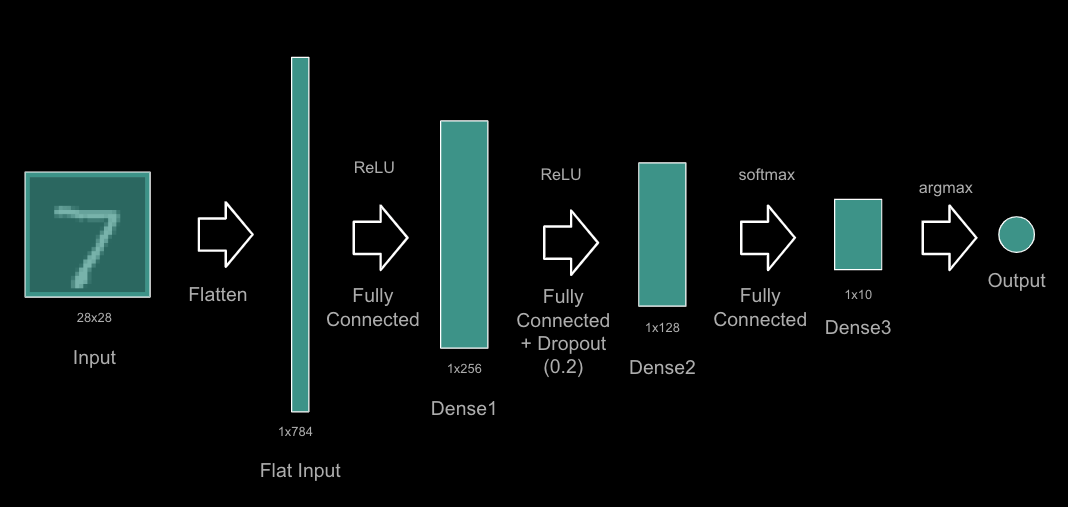
MNIST Classification with an ANN
November 2023
This notebook creates a simple Artificial Neural Network with keras to classify handwritten digits from the iconic MNIST dataset.
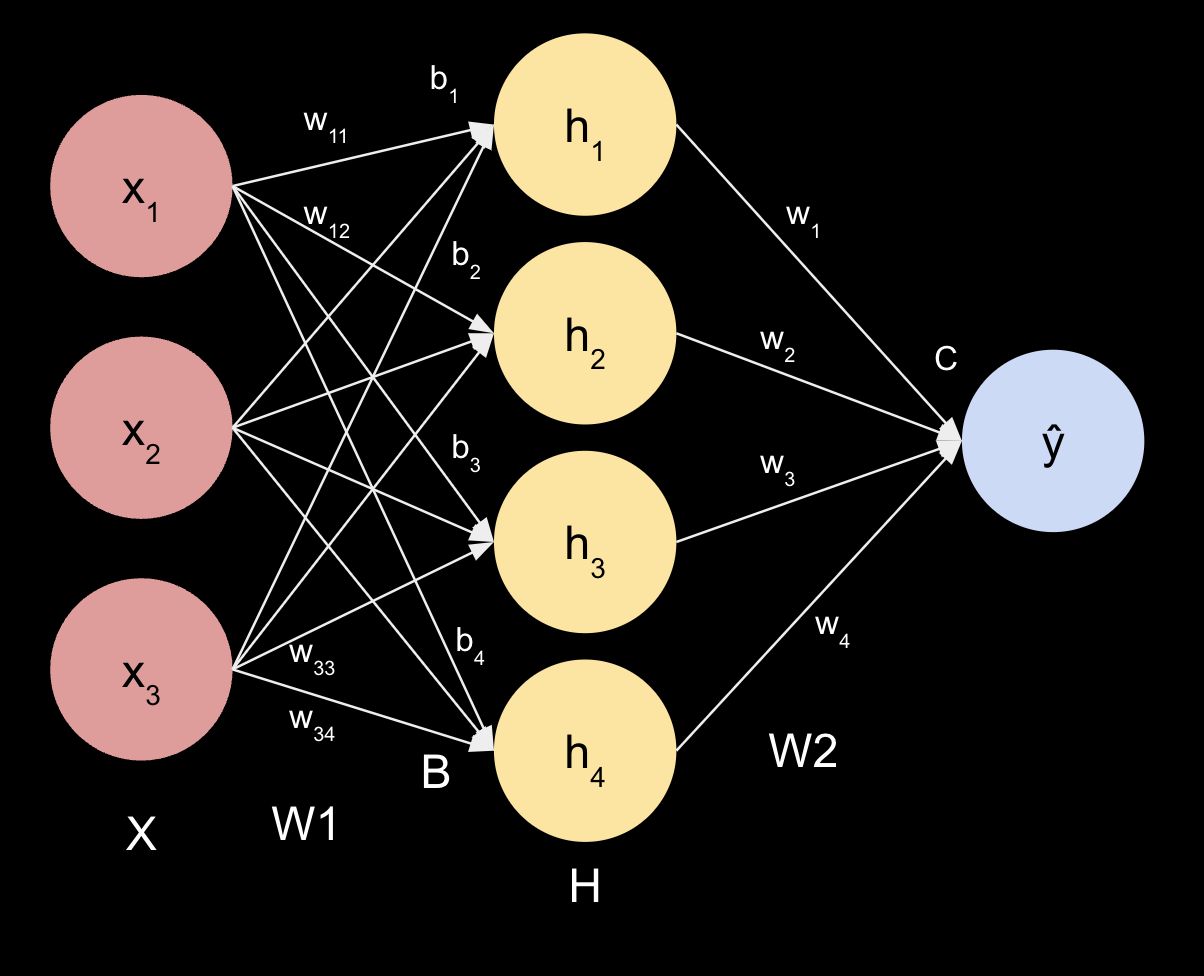
Coding Simple Neural Networks by Hand
October 2023
This notebook creates 2 simple neural networks using just pandas and numpy. Functions for feedforward, backpropagtation, and gradient descent are coded mathematically.
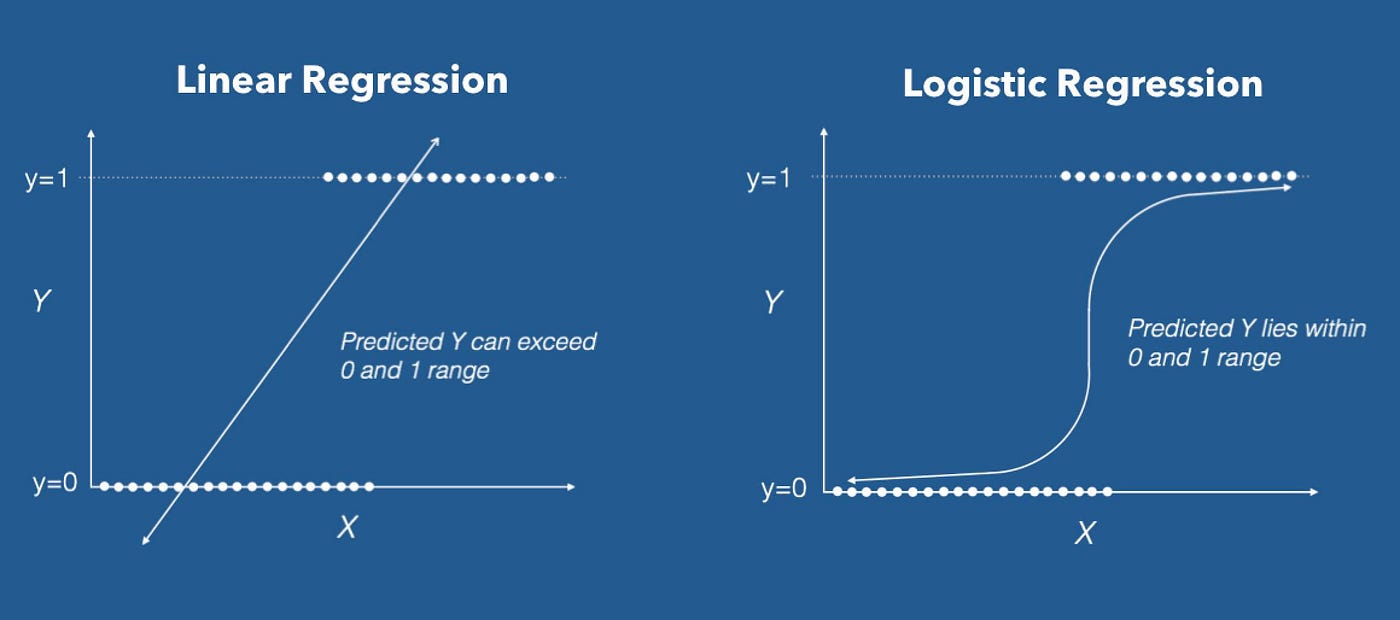
Coding Logistic Regression by Hand
September 2023
This notebook creates a model that performs logistic regression using just pandas and numpy.
Machine Learning for Demographic & Health Surveys
May 2023
This project explores relationships between demographics and assets in USAID's Demographic & Health Surveys (DHS) using unsupervised learning such as K-means clustering and association rule mining, as well as supervised learning such as Naive Bayes, regression, and support vector machines.
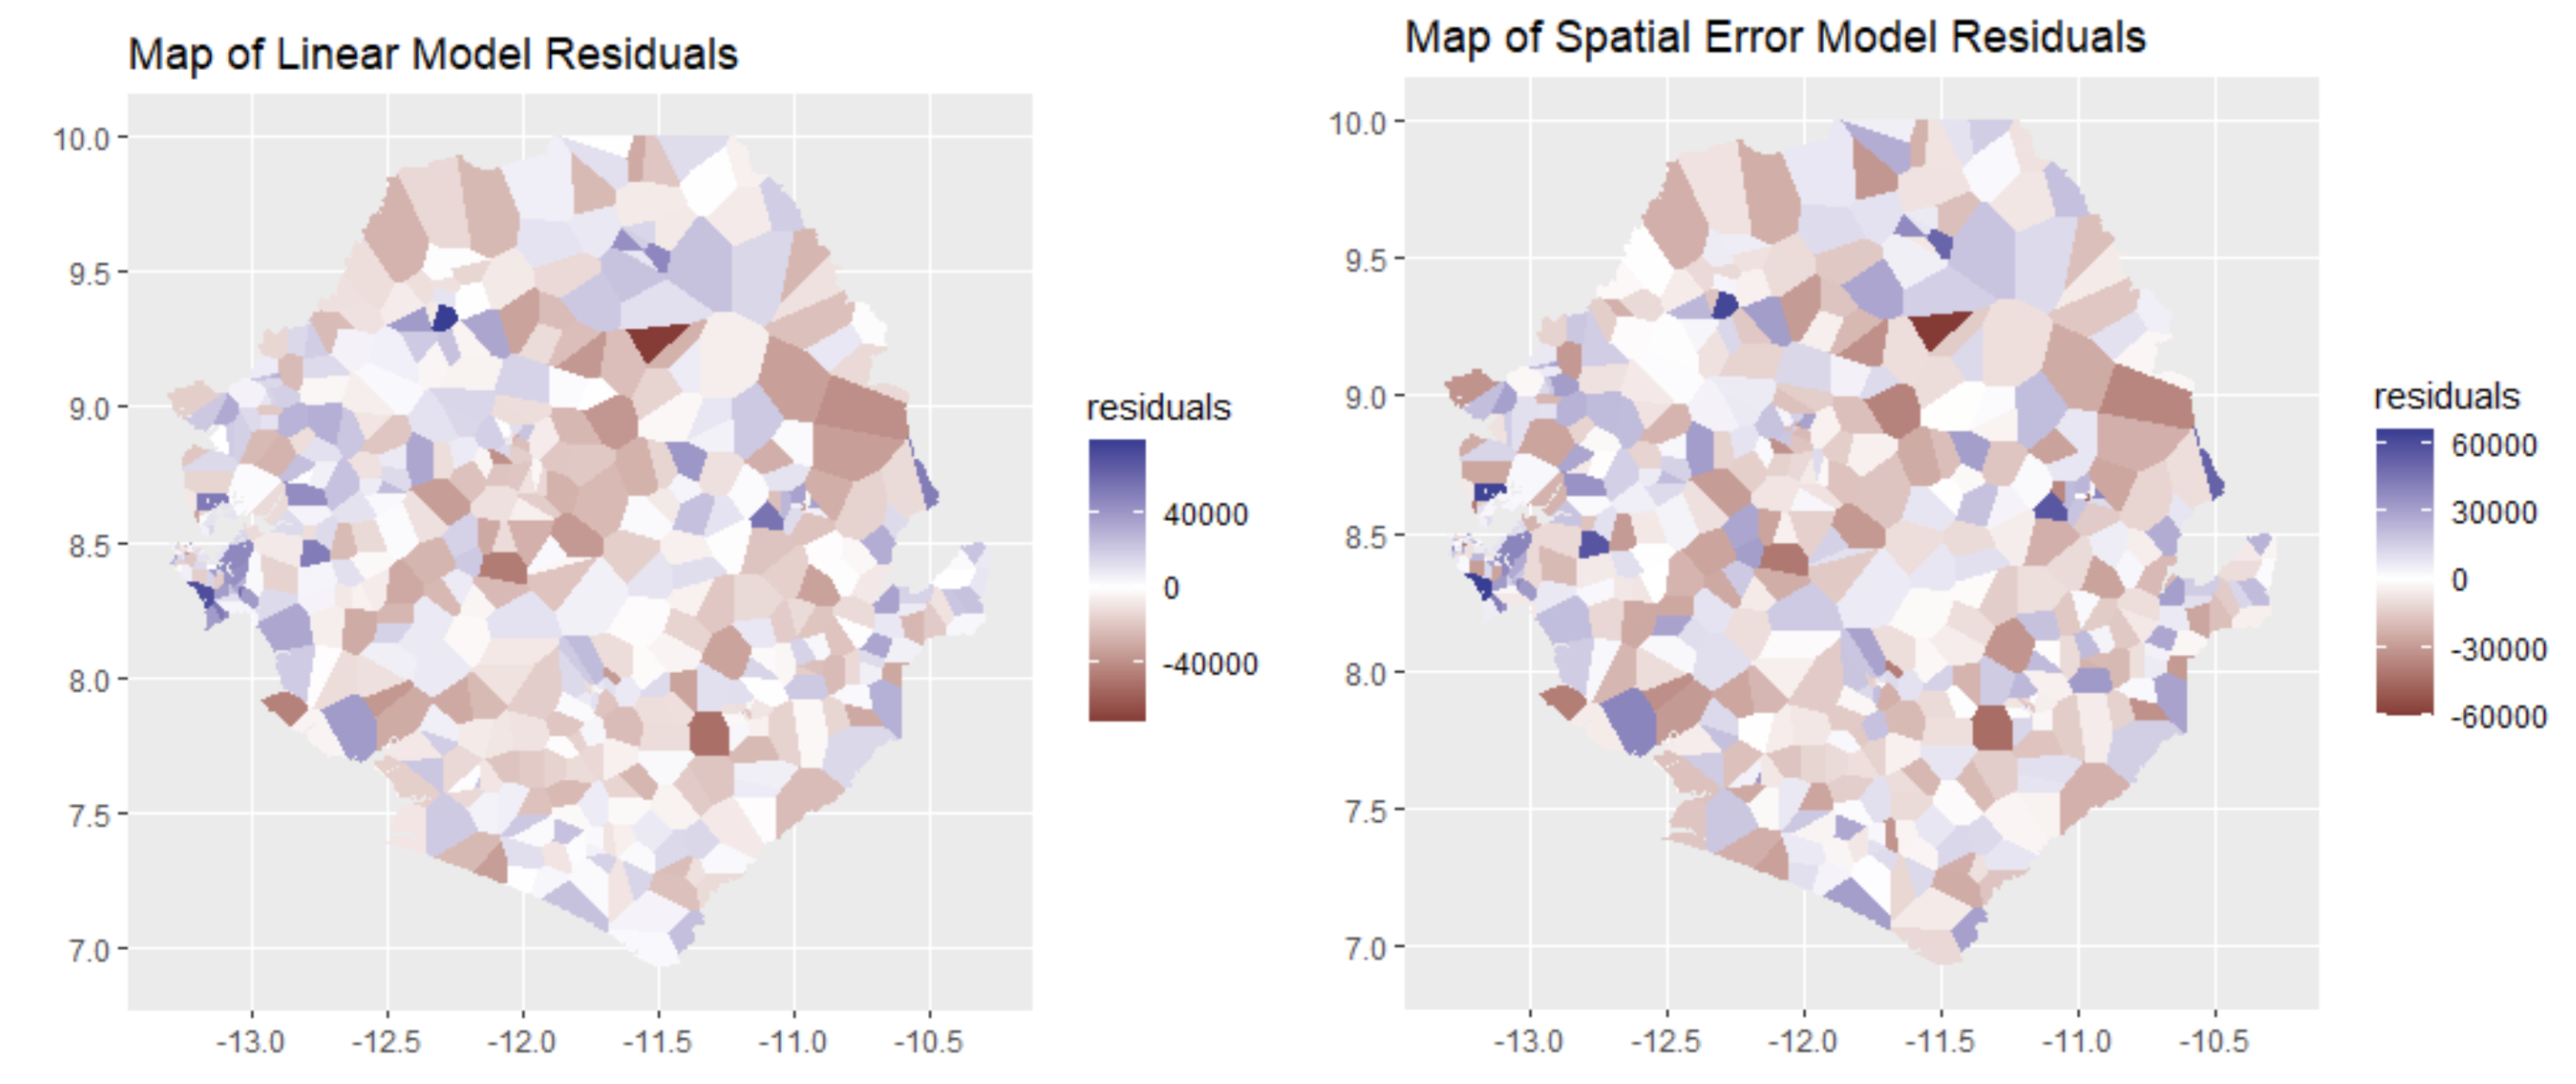
Spatial Statistics for Assets & Demographics
April 2023
This project explores spatial relationships between demographics and assets in USAID's Demographic & Health Surveys (DHS) in Sierra Leone. Techniques used include mapping, spatial regression, kriging, geographically weighted regression, and decision trees.